

Design a Distributed Change Data Capture (CDC) System
Difficulty: Mid-to-Senior Level · One of MongoDB's signature system design questions
We believe this question, "design a system that captures every change in a database and streams it to consumers in real time", appears frequently in MongoDB's system design interviews, and it is the single best example of how MongoDB interviews differ from everyone else's.
MongoDB is notorious for asking you to design a real component of its own product. This one maps almost one-to-one onto MongoDB Change Streams and the oplog underneath them. The interviewers build this for a living, so they can tell in seconds whether you actually understand it or are hand-waving. The flip side: if you do understand it, you'll have one of the most genuinely impressive conversations of your interview loop.
📚 How to prepare, and it's a cheat code. Because MongoDB asks about its own internals, the study material is MongoDB's own public documentation. If you have time before your interview, skim every page of the MongoDB Manual, not to memorise it, but to absorb the trade-offs MongoDB themselves made.
For this question specifically, study the Change Streams documentation really well, read it slowly, more than once. Candidates have repeatedly reported recognising the interview prompt as a thing they'd read about in those exact docs. We've distilled the essentials below, but the docs are your source of truth.
🧭 Expect a different shape of answer. This is not "design Twitter." MongoDB interviewers don't want a generic three-tier diagram with a load balancer, an API gateway, and a CDN. They want you to talk, to trace data flows, reason about where bytes physically live, explain inputs and outputs at each layer, and defend ordering and durability guarantees under failure.
So our walkthrough below deliberately spends less time on API contracts (you may barely need them here) and much more on the mechanics: how a write becomes a durable log entry, how that entry becomes a consumer-facing event, and how ordering survives sharding. Depth beats breadth. The candidate who can say "here is exactly what happens, byte by byte, when a consumer calls for the next event" is the one who gets the Strong Hire.
Understanding the Problem
🎯 What is a Change Data Capture (CDC) system?
You have a database that applications write to. Other systems need to react to those writes in real time, a search index needs updating, a cache needs invalidating, an analytics pipeline needs feeding, a downstream microservice needs notifying. CDC is the infrastructure that detects every mutation (insert, update, delete) and delivers those mutations as an ordered stream of events to interested consumers, reliably, in order, and without losing anything.
We'll design the system generically first (how CDC works in principle), then show how MongoDB implements each piece, because demonstrating that you understand their specific design decisions is exactly what earns the "Strong Hire."
A reading-order trick that will make you sound senior. Reason about this system from the inside out, start deep inside the database engine where changes are physically recorded, then move outward to how those changes become structured events, then to how an application server connects and receives them. The first three layers are where the interviewer lives. The last layer (pushing to a browser) is your application's problem, not the database's, and saying so out loud signals you understand the boundary.
Who actually consumes the change stream?
This is the first thing to clarify, and getting it right immediately separates you from candidates who imagine the "consumer" is a web browser. The consumer is a backend application server you write and deploy, a process holding a direct connection to the database, receiving events over that connection. Common consumer types:
| Consumer | What it does with changes |
|---|---|
| Search indexer | Keeps an Elasticsearch / Atlas Search index in sync with the database |
| Cache invalidator | Evicts or refreshes Redis entries when the source of truth changes |
| ETL pipeline | Transforms and loads changes into a data warehouse (Snowflake, BigQuery) |
| Event-driven microservice | Reacts to domain events (new order → send confirmation email) |
| Materialized view builder | Maintains pre-computed aggregations / summary documents |
| Audit log writer | Records every mutation to an immutable collection for compliance |
| Cross-region replicator | Replays changes to a cluster in another region |
In every case the consumer is a server-side process you control, with the database driver installed, holding a connection to the database.
Clarifying Questions to Ask
Strong candidates drive the scope before designing. Ask:
- "Who are the consumers?", Internal microservices? External partners? A managed platform feature?
- "What ordering guarantees do consumers need?", Per-document? Per-collection? Global across the whole database?
- "What delivery semantics?", At-least-once is simpler; exactly-once needs transactional checkpoints.
- "How far back must consumers be able to replay?", Minutes? Hours? Days?
- "Is the database sharded?", Single-node ordering is trivial; cross-shard ordering is the hard, interesting part.
- "Full document, or just the delta?", Drives storage and bandwidth decisions.
For this design we'll assume: multiple consumer types, at-least-once delivery with a path to exactly-once, per-document ordering guaranteed, global ordering across shards as a goal, and a replay window of 24–72 hours.
Functional Requirements
| # | Requirement | Detail |
|---|---|---|
| FR-1 | Capture all mutations | Every insert, update, replace, and delete is captured. No silent loss. |
| FR-2 | Deliver events in order | Events for the same document arrive in the order they were applied. Cross-document ordering is best-effort or configurable. |
| FR-3 | Server-side filtering | Consumers subscribe to a subset, by collection, operation type, or field values, filtered on the server to save bandwidth. |
| FR-4 | Resumable consumption | A crashed consumer resumes from its exact position: no reprocessing, no gaps. |
| FR-5 | Full-document access | Consumers can optionally receive the complete document, not just the delta. |
| FR-6 | Pre- and post-images | For updates/deletes, consumers can optionally get the document before and after the change, captured at write time. |
| FR-7 | Many concurrent consumers | Independent consumers read the same stream at different speeds without interfering. |
Non-Functional Requirements
| # | Requirement | Target |
|---|---|---|
| NFR-1 | Latency | Events delivered within ~100ms–1s of commit (p95). |
| NFR-2 | Throughput | 50k–100k+ events/sec per replica set; millions/sec across a sharded cluster. |
| NFR-3 | Durability | Zero loss for committed writes. If the DB accepted the write, the event is eventually delivered. |
| NFR-4 | Availability | Streams survive primary failovers automatically, with no manual intervention. |
| NFR-5 | Replay window | At least 24–72 hours of history for consumer catch-up. |
| NFR-6 | Consistency | Events reflect majority-committed writes only, no phantom events from rolled-back writes. |
Core Entities
Five entities carry the whole design. Naming them crisply up front buys you a lot of credibility.
- Operation Log Entry, the raw, internal record of a single mutation, appended to an append-only log inside the database engine. Ordering key, operation type, namespace, document key, and payload.
- Change Event, the consumer-facing representation, derived from a log entry but with a stable, versioned schema, optional full document / pre-images, and a resume token. This is what your app actually receives.
- Resume Token, an opaque marker encoding a consumer's exact position in the stream. The consumer never parses it; it just stores it and hands it back to resume.
- Consumer Checkpoint, a durable record (a document you store) of the last successfully processed resume token, so a restarted consumer knows where to continue.
- Consumer Group, a set of consumers cooperatively processing one stream in parallel. (Note for later: unlike Kafka, MongoDB has no built-in consumer groups. You build this yourself.)
Inputs and outputs, stated plainly. This framing alone impresses MongoDB interviewers:
- Input to the whole system: a committed write (insert/update/delete) on the database.
- Output: an ordered sequence of Change Events, each carrying enough context (operation type, document key, optional full/pre-image, resume token) for a consumer to act and to resume after a crash.
Everything between input and output is the design, and it's all about where the data physically sits and who transforms it, when.
High-Level Design: The Two-Hop, Four-Layer Architecture
Start with the whole board, then zoom in. Here is the entire system the way you would actually draw it on a whiteboard, one write flowing left to right: an app issues the write, the replica set turns it into a durable oplog entry, the in-engine change-stream cursor transforms that entry into an event, your consumer pulls it and checkpoints its position, and a downstream target reacts. The dashed final hop to a browser is your application's concern, not the database's. Everything below this, the two-hop split, the four-layer flow, and the deep dives, is just us zooming into the boxes of this one picture.
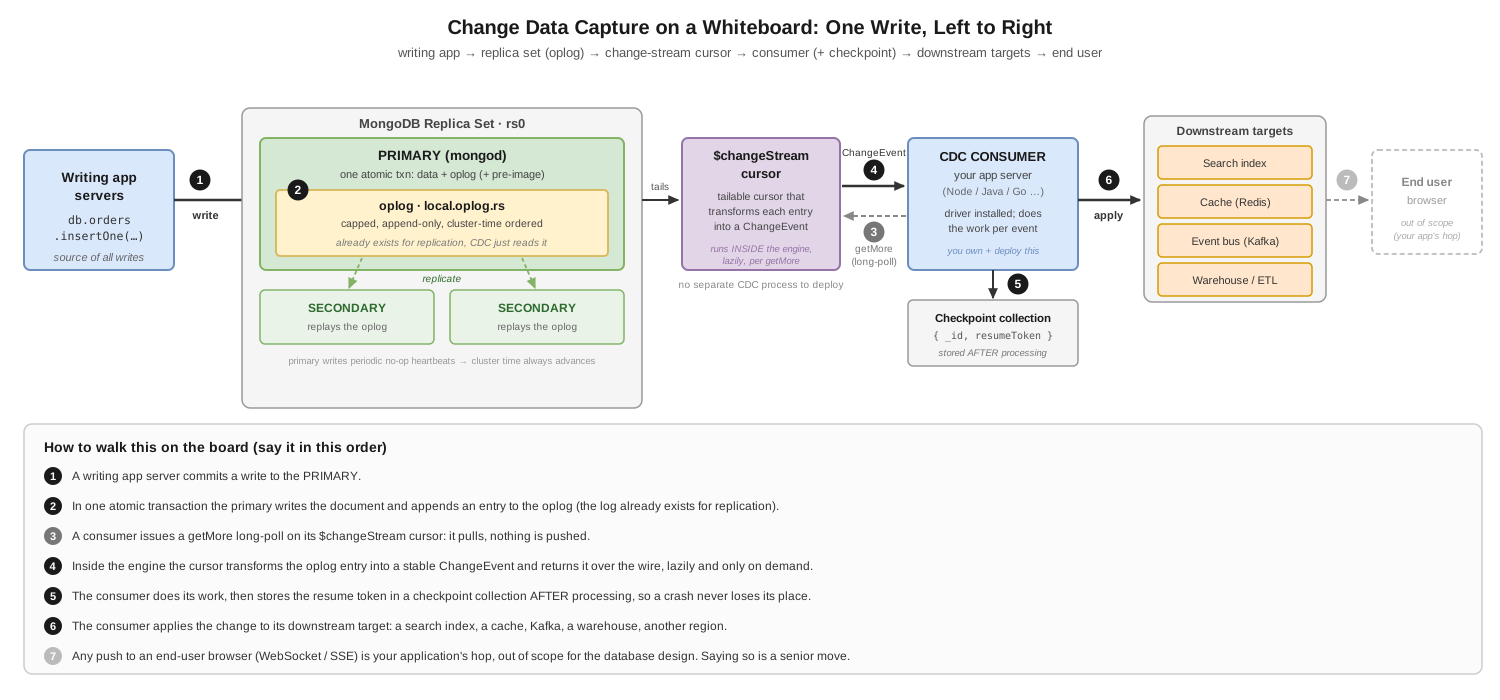
The CDC system on a whiteboard: one write, left to right
The two-hop insight (lead with this)
The cleanest way to open your answer is to point out that a CDC system that ultimately reaches end users has two completely separate communication channels, and the interviewer only cares about the first one:
            HOP 1                                  HOP 2
      (the database's domain)                   (your domain)
┌──────────┐  binary wire protocol  ┌──────────────┐   HTTP / WS / SSE  ┌──────────┐
│          │  (TCP, direct, long-   │              │   (your choice)    │          │
│ Database │  polling for events)   │  Your App    │                    │  End     │
│  engine  │ ◄────────────────────► │  Server      │ ◄────────────────► │  User    │
│ (mongod) │                        │ (the CONSUMER)│                   │  Browser │
└──────────┘                        └──────────────┘                    └──────────┘
  You don't control this             You own this                       You own this
  (the DB server)                    (Node, Java, Go, …)                 (React, etc.)
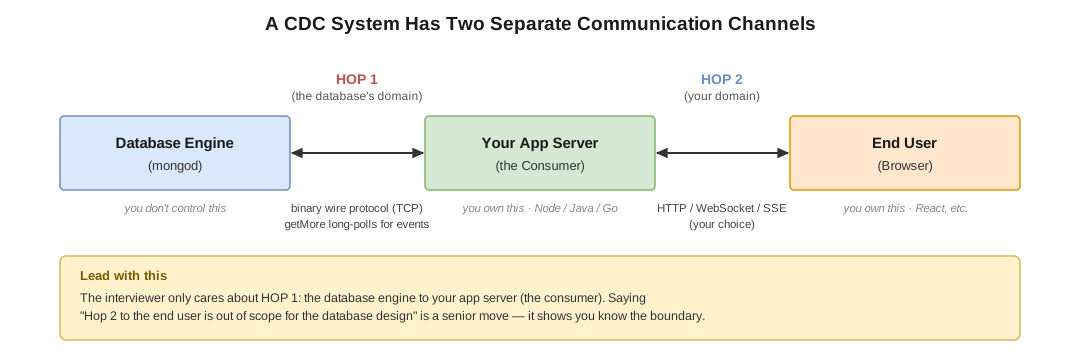
The two communication channels of a CDC system
Hop 1, database engine ↔ your app server: your server has the database driver installed; it opens a raw TCP connection and speaks the binary wire protocol. When it asks for the next change, it sends a getMore command that blocks (long-polls) until events arrive. This is the part the interviewer cares about.
Hop 2, your app server ↔ end user: entirely your application's concern (WebSocket, SSE, or nothing at all). The database has no opinion here. Saying "this hop is out of scope for the database design" is a senior move. It shows you know the boundary.
The four layers (end-to-end data flow)
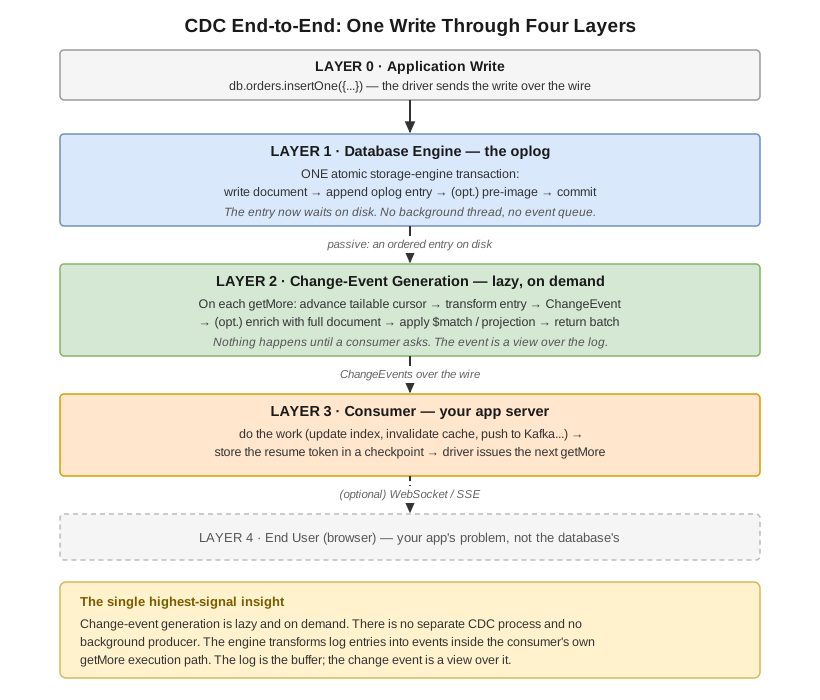
Now trace a single write all the way through. This diagram is the answer, most of the interview is spent zooming into Layers 1–3.
LAYER 0 — APPLICATION WRITE
  Your app calls db.orders.insertOne({...}); the driver sends a write over the wire.
        │
        ▼
LAYER 1 — DATABASE ENGINE (the oplog)
  Inside ONE atomic storage-engine transaction:
    1. Write the document to the collection's data files
    2. Append an entry to the operation log (the "oplog")
    3. (optional) Write a pre-image snapshot
    4. Commit  ← all-or-nothing
  The oplog entry now sits on disk. NOTHING else happens automatically.
  No background thread. No event queue. The entry just waits to be read.
        │  (passive: an ordered entry on disk)
        ▼
LAYER 2 — CHANGE EVENT GENERATION (inside the engine, ON DEMAND)
  Nothing happens here until a consumer asks. When a consumer's getMore arrives:
    1. Advance a tailable cursor over the oplog
    2. Read new entries for the watched namespace
    3. Transform each raw entry → stable ChangeEvent schema
    4. (optional) look up the full document / pre-image
    5. Apply the consumer's filter ($match) and projection
    6. Return the matching events in the getMore response
        │  (ChangeEvent documents over the wire)
        ▼
LAYER 3 — CONSUMER (your app server)
  Receives ChangeEvents via the driver. For each event:
    1. Do the work (update the index, invalidate cache, push to Kafka…)
    2. Store the resume token in a checkpoint collection (durably)
    3. The driver issues the next getMore automatically
        │  (optional) WebSocket / SSE
        ▼
LAYER 4 — END USER (browser) — your app's problem, not the database's.
CDC end-to-end: one write through four layers
The single highest-signal sentence you can say about this system: "Change-event generation is lazy and on-demand, there is no separate CDC process and no background thread proactively producing events. The database engine transforms log entries into events inside the consumer's own getMore execution path. The log is the buffer; the change event is a view over it."
Most candidates assume a background producer pushing to a queue (that's how an external connector like Debezium works). Knowing that MongoDB does it in-process and on-demand is what makes an interviewer lean forward.
Advanced Technical Deep Dives
This is where MongoDB interviews are won or lost. Each deep dive below is a conversation you should be able to lead.
1) Layer 1: The operation log: what gets stored, where, and how
Every CDC system starts with an ordered, append-only log of write operations. The beautiful part: this log already exists, because databases keep a write-ahead / replication log anyway. CDC just lets extra consumers read it. That's why CDC is architecturally cheap. It reuses infrastructure that's already there for crash recovery and replication.
In MongoDB this log is the oplog (local.oplog.rs), a capped collection (fixed size, append-only, oldest entries overwritten when full). Two facts about it routinely trip up candidates, so lead with them:
(a) It is NOT a separate file, and NOT per-collection or per-database. It is per replica set. One oplog holds every write to every collection in every database on that replica set, interleaved in one ordered sequence:
Replica set "rs0" — ONE oplog shared by everything
──────────────────────────────────────────────────
 Timestamp(100,1)  INSERT  ecommerce.orders     { _id: 1, total: 99 }
 Timestamp(100,2)  UPDATE  ecommerce.products   { _id: 5, price: 29.99 }
 Timestamp(100,3)  INSERT  analytics.pageviews  { _id: 9, url: "/home" }
 Timestamp(101,1)  DELETE  ecommerce.orders     { _id: 1 }
 ALL databases. ALL collections. ONE ordered sequence.
Why it matters: a high-write collection you don't even care about burns oplog space and shrinks the replay window for the collection you do watch. And a consumer watching orders still causes the server to scan oplog entries for all namespaces, skipping the irrelevant ones, scan cost is proportional to total write volume, not just your target's. (This is also why managed MongoDB pushes noisy multi-tenant workloads toward dedicated clusters: oplog space is a shared, finite resource.)
(b) Sizing determines your replay window, and it's a function of write throughput, not time. A 50 GB oplog at 1,000 writes/sec might hold 72 hours; the same oplog at 100,000 writes/sec might hold 2 hours. Size the oplog for your worst-case consumer downtime (planned maintenance plus an unplanned failure).
The ordering primitive: a logical clock, not a wall clock
The most impressive thing you can explain here is why ordering uses a logical clock. In a distributed system, wall-clock time is a liar, two servers' clocks drift, and NTP only gets within a few milliseconds, which is exactly where ordering bugs hide.
MongoDB stamps each oplog entry with a Timestamp(seconds, increment) it calls cluster time, and the key insight is who assigns it: the primary, sequentially. Not any client. Walk the interviewer through this:
TWO app servers send writes to the SAME primary at "the same time".

  WALL-CLOCK ordering (broken):
    App A's clock says 10:00:00.180, App B's says 10:00:00.200.
    But B's write physically arrives at the primary FIRST (faster network).
    Using app wall clocks, you'd order A before B — the OPPOSITE of what
    the database actually did. A consumer would see a history that never happened.

  LOGICAL-CLOCK ordering (correct):
    The primary ignores both clocks. It stamps whatever arrives first:
      B's write → Timestamp(1718460000, 1)
      A's write → Timestamp(1718460000, 2)
    This always matches the real apply order. Regardless of client clocks.
    Regardless of network latency. THIS is the guarantee.
Interview-ready line: "Ordering comes from a Lamport-like logical clock, cluster time, assigned sequentially by the primary. It doesn't matter what any client's wall clock says; the primary's assignment order is the truth. Within a replica set that gives a total order. Across shards, each shard has its own primary, so the clocks are coordinated by a gossip protocol, which is where the interesting distributed-systems work is."
2) Layer 2: Change-event generation: who transforms the log, and when
This is the layer most people get wrong. Kill the wrong mental models explicitly, doing so out loud is high-signal:
- ❌ There is no separate "CDC server" tailing the log (that's Debezium's external model, not MongoDB's).
- ❌ There is no background thread inside the engine proactively producing events to a queue.
- ❌ The driver does not transform raw log entries client-side.
What actually happens: when the consumer calls collection.watch(...), the driver sends an aggregate command whose first stage is $changeStream. The engine opens an internal tailable cursor on the oplog. Then, on each getMore (the long-poll), the engine advances that cursor, transforms matching raw entries into the stable ChangeEvent schema, optionally enriches them, applies the consumer's pipeline, and returns a batch, or, if nothing matched, holds the connection open and eventually returns an empty batch plus a postBatchResumeToken ("I've seen everything up to here").
// Runs on YOUR app server. The driver owns the TCP connection + wire protocol.
const pipeline = [{ $match: { operationType: { $in: ["insert", "update"] } } }];
const stream = db.collection("orders").watch(pipeline, { fullDocument: "whenAvailable" });

stream.on("change", async (event) => {
  await processEvent(event);                 // your work: index, cache, notify…
  await saveResumeToken("orders-consumer", event._id);  // checkpoint AFTER processing
});
Why in-process and on-demand? The trade-off table
| Benefit of in-engine, lazy generation | But the trade-off is… |
|---|---|
| No separate CDC infrastructure to deploy/scale, the DB is the CDC server | Heavy stream workloads consume CPU/memory on your database |
Full local context: fullDocument and pre-image lookups hit local disk, no extra network hop | Expensive fullDocument lookups add read load to the primary |
| Reuses the aggregation framework, consumers filter/project with familiar syntax | Filtering happens after the oplog scan, so scan cost isn't reduced by the filter |
| Each consumer gets its own server-side pipeline, evaluated independently | More consumers ⇒ more concurrent oplog scans |
The fullDocument race condition: a favourite follow-up
For updates, the oplog stores only the delta. If a consumer wants the whole document, there are two modes, and one is a trap:
| Mode | How it gets the full doc | Verdict |
|---|---|---|
updateLookup | Queries the collection at getMore time | ⚠️ Race condition: if the doc was updated again before the lookup, fullDocument reflects the later state, inconsistent with the delta. |
whenAvailable | Reads a pre/post-image captured at write time | ✅ Recommended: image always matches the delta. Returns null if expired. |
Say this: "I'd use whenAvailable backed by pre-images captured atomically with the write, not updateLookup, because updateLookup has a fundamental race, the looked-up document can be newer than the change it's attached to." That one sentence demonstrates you've actually thought about consistency, not just wired up an API.
3) Layer 3: Consumer architecture: checkpoints, exactly-once, and scaling
The consumer is your app server. Its two hard jobs are not losing its place and going faster than one stream allows.
The checkpoint rule (and how to get exactly-once)
The rule is one sentence: store the resume token AFTER you've processed the event, never before, never skip. Where it gets interesting is the failure window between doing the work and saving the token. Here's the elegant trick when your downstream target is the same MongoDB cluster, make the work and the checkpoint one atomic transaction:
stream.on("change", async (event) => {
  const session = client.startSession();
  session.startTransaction();
  try {
    // 1) the actual work (e.g., maintain a materialized view)
    await db.collection("orderSummaries").updateOne(
      { customerId: event.fullDocument.customerId },
      { $inc: { totalOrders: 1, totalSpent: event.fullDocument.total } },
      { session });
    // 2) the checkpoint — in the SAME transaction
    await db.collection("checkpoints").updateOne(
      { _id: "orders-summary" },
      { $set: { resumeToken: event._id } },
      { upsert: true, session });
    await session.commitTransaction();       // both succeed, or both roll back
  } catch (e) {
    await session.abortTransaction();        // event will be redelivered — no loss
  }
});
Why it's exactly-once: crash after commit → checkpoint saved, no redelivery. Crash before commit → both roll back, the event is redelivered and reprocessed. No skips, no duplicates. For a downstream you can't enrol in a MongoDB transaction (Kafka, Elasticsearch, an HTTP API), you fall back to at-least-once + idempotency: dedupe on the event's unique id (a processedEvents collection with a TTL index) so reprocessing is harmless.
Scaling consumers: and the catch nobody mentions
One cursor processes events serially. Three ways to parallelise, in increasing power and cost:
- Collection-level partitioning, each consumer watches a different collection. Zero coordination. The first thing to reach for.
- Hash-partitioned consumer group, open N cursors on the same collection, each with a
$matchonhash(documentKey._id) mod N == i. All events for a given_idalways land on the same consumer, so per-document ordering is preserved. The catch: all N cursors scan the oplog, each discarding ~(N-1)/N of events. You trade N× server-side read amplification for client-side parallelism. - Direct shard consumption, bypass the router and connect to each shard. Maximum throughput, but you give up global ordering (events arrive in per-shard order only) and now manage one checkpoint per shard.
A killer "I know this product" detail: unlike Kafka, MongoDB has no built-in consumer groups, no native partition assignment, no rebalancing. You implement the hash-partitioned scheme yourself, and each consumer stores its own independent checkpoint. Naming this gap (and how you'd fill it) shows you've worked with both systems.
Poison events and the Dead Letter Queue
Because events must be processed in order, one event that always fails will block the entire stream forever. The fix is a Dead Letter Queue: retry up to N times, then write the bad event to a deadLetterQueue collection, advance the resume token past it, and keep going. Liveness preserved; the poison event is quarantined for a human to inspect.
4) Ordering across shards: the merge-sort barrier (the hardest part)
On a single replica set, ordering is free: one oplog, one primary, one total order. Sharding shatters that, each shard is an independent replica set with its own oplog, its own primary, and its own cluster-time sequence. This deep dive is where senior candidates pull ahead, so spend time here.
Here is the sharded version of the board. It is the same left-to-right picture you drew earlier, except the database is now split across shards with a router (mongos) sitting in front. Trace it the same way, and notice the crucial thing: the consumer's side does not change at all. It still opens one stream and stores one token. Everything new happens at the router, which fans out, merge-sorts, and hands back a single ordered stream.
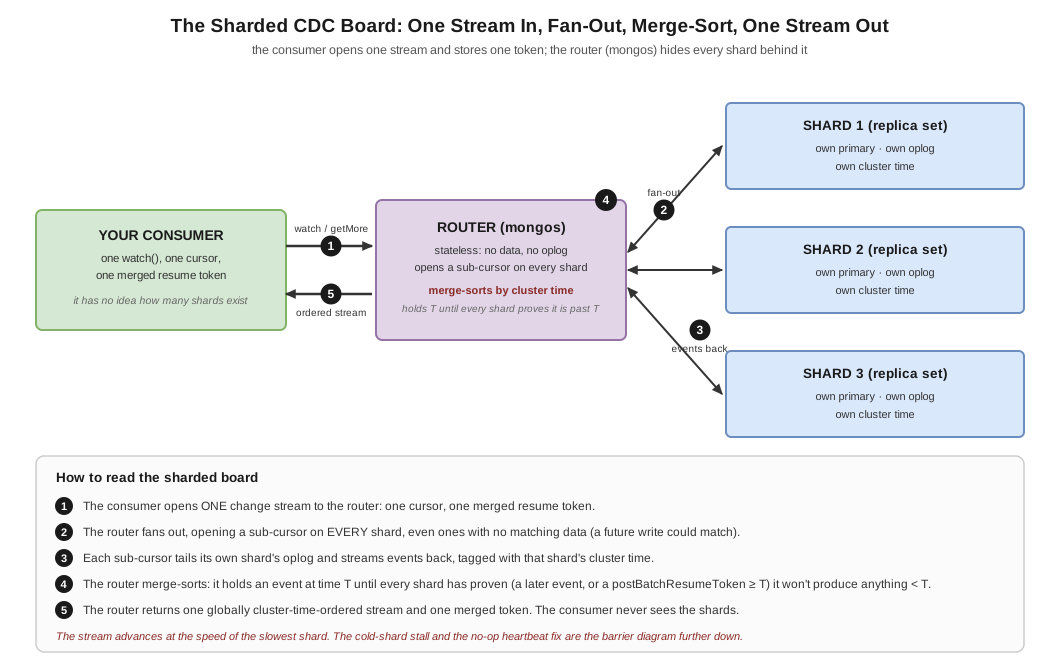
The sharded CDC board: one stream in, fan-out, merge-sort, one stream out
Topology: the consumer talks to the router, never to shards
   YOUR CONSUMER  ──(one connection, one cursor, one resume token)──►  ROUTER (mongos)
                                                                          │
            mongos is stateless: no data, no oplog. It routes and        │
            coordinates. It opens a sub-cursor on EVERY shard.           │
                          ┌───────────────────────┼───────────────────────┐
                          ▼                       ▼                       ▼
                       SHARD 1                  SHARD 2                  SHARD 3
                   (replica set)            (replica set)            (replica set)
                   own oplog +              own oplog +              own oplog +
                   own primary +            own primary +            own primary +
                   own cluster time         own cluster time         own cluster time
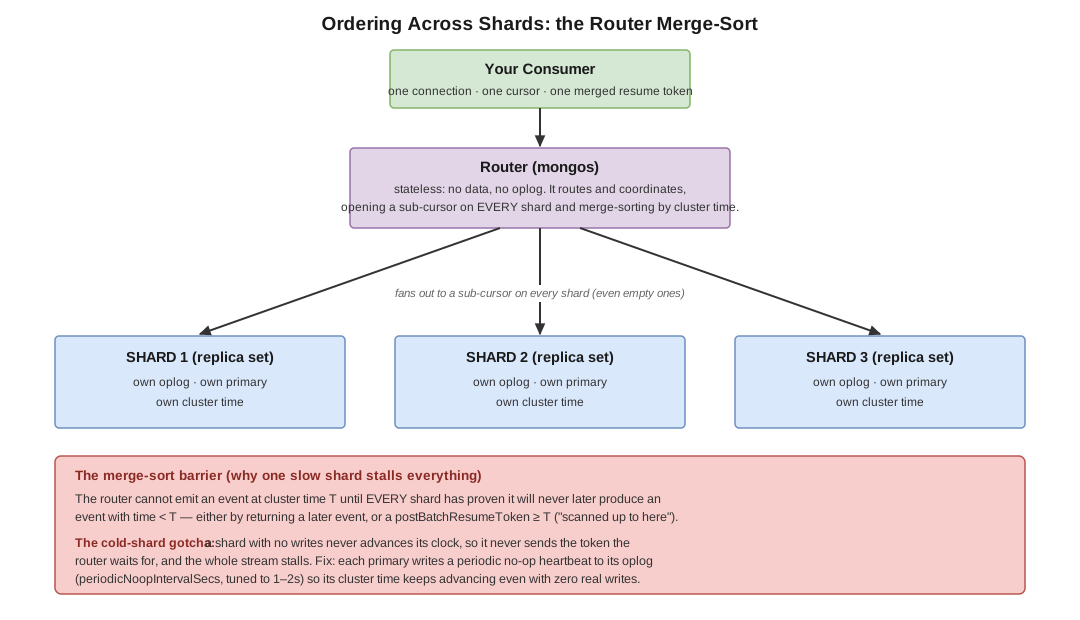
Ordering across shards: the router merge-sort
The consumer has no idea how many shards exist. It opens one stream; the router fans out to sub-cursors on every shard (even shards with zero matching data, because a future write to any shard could match).
The problem: three independent clocks
Each shard's primary assigns cluster time based on its own write traffic, so at any instant the shards sit at different timestamps. If three near-simultaneous writes land on three shards, the consumer must still receive them in globally sorted cluster-time order. How does the router guarantee that without a global clock?
The merge-sort barrier protocol
The router buffers the latest events/tokens from each shard and applies one rule:
The router cannot emit an event with cluster time
Tuntil every shard has proven it will never later produce an event with time< T.
A shard "proves" it has passed T either by returning a later event, or by returning a postBatchResumeToken ≥ T (i.e. "I scanned my oplog up to here and found nothing for you"). Walk it:
State:  Shard 1 → event at T=1000.47,  token T=1000.47
        Shard 2 → event at T=1000.12,  token T=1000.12
        Shard 3 → no events,           token T= 999.89   ← behind!

Smallest candidate: Shard 2's event at T=1000.12. Can we emit it?
  Shard 1 token 1000.47 ≥ 1000.12   ✅
  Shard 2 is the source                ✅
  Shard 3 token  999.89 < 1000.12   ❌  BLOCKED — Shard 3 might still
                                          produce something older than 1000.12.

→ The router holds the consumer's response open and waits for Shard 3 to advance.
  When Shard 3 finally reports a token ≥ 1000.12, the event is released.
The whole stream therefore moves at the speed of the slowest shard. Which leads directly to the most famous gotcha…
The cold-shard problem (and the heartbeat fix)
A cold shard, one with no write traffic for the watched data, never advances its cluster time, so it never sends the token the router is waiting for, and the entire stream stalls. (Subtle but important: writes to any collection on that shard advance its oplog and unblock the merge, only a shard with zero writes to anything is truly cold.)
MongoDB's fix is elegantly simple: each primary writes a periodic no-op to its own oplog, advancing its cluster time even with no real writes. This single knob is a latency/overhead trade-off worth quoting precisely:
periodicNoopIntervalSecs | Worst-case cold-shard latency | Oplog overhead |
|---|---|---|
| 10 (default) | up to ~10s per event | minimal |
| 2 | up to ~2s | slight |
| 1 | up to ~1s | noticeable on many-shard clusters |
Interview line: "A single slow or cold shard stalls the global merge because the router can't prove ordering without it. The mitigation is periodic no-op heartbeats on each primary, I'd tune the interval down to 1–2 seconds to cap tail latency, accepting a little oplog churn."
One merged resume token: not one per shard
A common trap question: "with three shards, do you store three resume tokens?" No. Through the router, the consumer stores one opaque, merged token that internally encodes the position on every shard. On resume, the router decodes it and re-positions each sub-cursor. The consumer stays blissfully unaware of shards.
| Approach | Connections | Resume tokens | Global ordering |
|---|---|---|---|
| Via router (normal) | 1 | 1 (merged) | ✅ router merge-sorts |
| Hash-partitioned group (via router) | N | N (each merged) | ✅ per-document |
| Direct shard consumption | one per shard | one per shard | ❌ per-shard only |
What global ordering does and doesn't promise
- ✅ Total order by cluster time, transaction atomicity (all events of a multi-doc transaction delivered together), and strict per-document ordering (a document lives on one shard, so its events come from one oplog).
- ❌ Causal ordering across independent sessions is not guaranteed, two unrelated writes on two shards may be delivered in cluster-time order that differs from wall-clock order. If you need it, use causally consistent sessions, which propagate cluster time so "A happened before B" is reflected across shards.
5) Failure modes and production hardening
A MongoDB interviewer will push on failure. Have crisp answers ready:
| Failure | What happens | Recovery |
|---|---|---|
| Transient network blip | Cursor disconnects | Driver auto-resumes from the last token. You write no retry code |
| Primary failover | Primary steps down, new one elected | Driver reconnects, resumes via resumeAfter; committed events were replicated → no loss |
| Oplog overflow | Consumer down longer than the replay window; resume token points to an overwritten entry | Error 136 (CappedPositionLost). Recover via a more recent checkpoint, startAtOperationTime, or a full re-sync |
| Watched collection dropped/renamed | Stream emits an invalidate and closes | Reopen with startAfter (designed to survive invalidate) |
| Consumer crash | Depends on when | Before checkpoint → event redelivered (be idempotent); transactional checkpoint → exactly-once |
| Event exceeds 16 MB | BSON limit hit | Use $changeStreamSplitLargeEvent, or don't request fullDocument for large docs |
The prevention that earns points: "I'd monitor consumer lag as a percentage of the oplog window and alert at ~50%, and size the oplog for worst-case downtime, because the only unrecoverable failure here is falling off the end of the oplog."
Numbers and Facts to Know Cold
| Thing | Value |
|---|---|
| Oplog type / scope | Capped collection (local.oplog.rs), one per replica set (all DBs/collections) |
| Default oplog size | ~5% of free disk (≈990 MB–50 GB) |
| Throughput | 50k–100k+ events/sec per replica set; millions/sec sharded |
| Cold-shard knob | periodicNoopIntervalSecs (default 10s; tune to 1–2s) |
| Max event size | 16 MB (BSON limit) |
| "Fell off the oplog" error | 136 (CappedPositionLost) / 286 |
| Cost per stream | 1 connection from the pool, for the stream's whole life |
| Resume modes | resumeAfter / startAfter / startAtOperationTime |
| Stable schema since | Change Streams in Stable API V1; pre/post-images since 6.0 |
The whole system in one paragraph (memorise this)
A CDC stream on MongoDB rides on the oplog, a capped, append-only collection, one per replica set, holding every write in cluster-time order (a logical clock assigned by the primary, not wall-clock time). Change Streams are a stable, resumable API over that log: the
$changeStreamaggregation stage, running inside the database engine itself, lazily transforms oplog entries into versioned change events when a consumer'sgetMorearrives, there is no separate CDC process. On a sharded cluster the consumer connects to the router (mongos), which opens a sub-cursor per shard and merge-sorts by cluster time, using periodic no-op heartbeats to keep cold shards from stalling the stream; the consumer stores one merged resume token and never sees the sharding. Consumers are app servers holding a driver connection, checkpointing after each event for crash-safe, optionally exactly-once processing.
Conclusion
Notice what this answer was, and wasn't. There was no load balancer, no API gateway, no hand-wavy "and then we add a cache." Instead we traced a single write from the disk it lands on, to the lazy transform that turns it into an event, to the router that merge-sorts it across shards, to the consumer that checkpoints it crash-safely. That depth, the ability to say exactly what happens, where, and when, is precisely what MongoDB hires for. Bring it, and this becomes the interview they remember.
Before you walk in: re-read the Change Streams documentation and the surrounding pages on replication, sharding, and the oplog. Everything in this walkthrough lives in those docs, internalise the why behind each decision and you'll be able to hold this conversation in any direction the interviewer takes it.
If this is the level of depth you want for the rest of your loop, that's exactly what the rest of our MongoDB track is built for, the practical coding rounds, the live peer-programming questions, and more system design problems drawn from the same playbook of "design a piece of MongoDB." Start from the MongoDB prep guide, and go in ready to talk.